Introduction to Journal Metrics
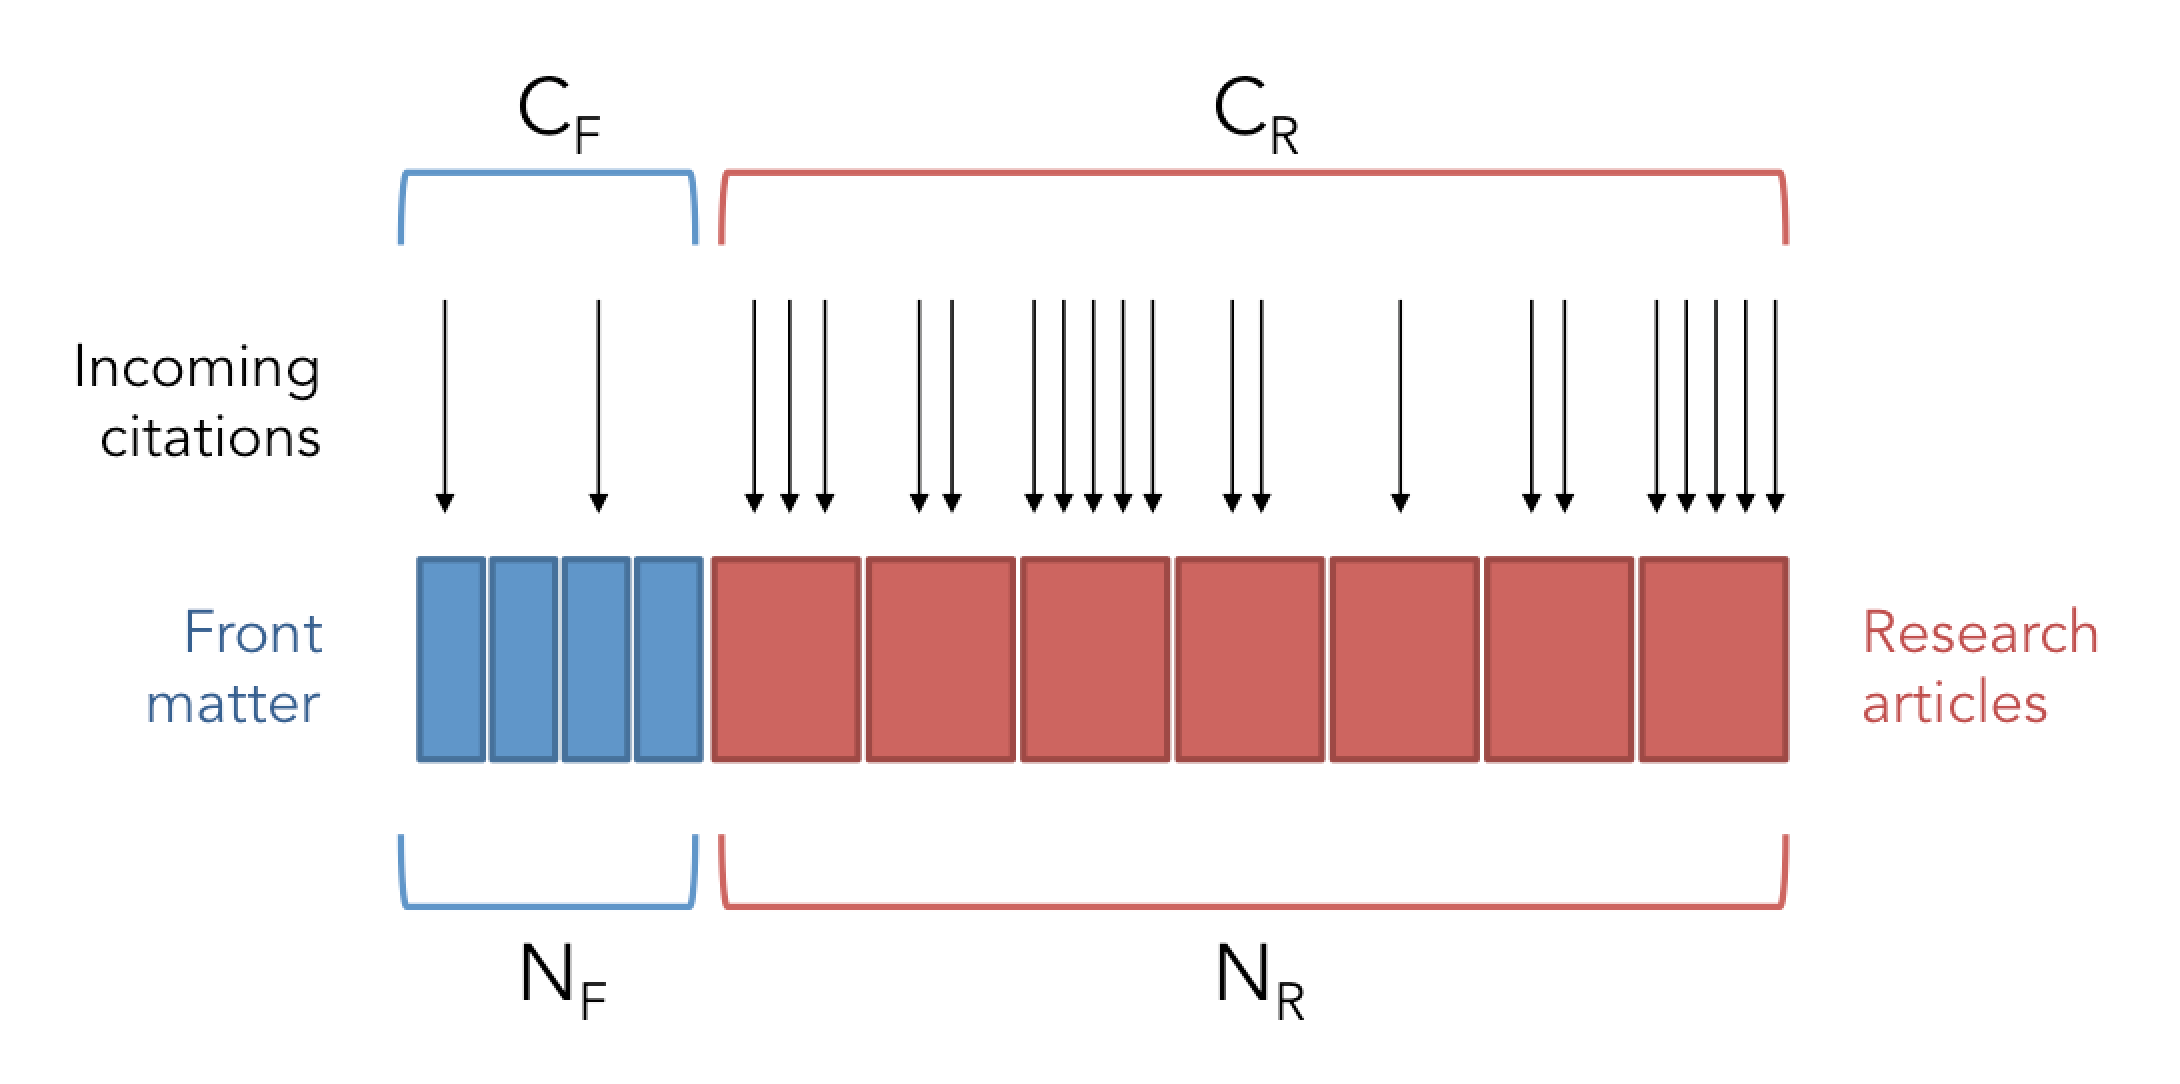
Journal metrics attempt to determine the impact of a journal by counting the number of citations to articles within the journal. The most commonly used journal metric is the Impact Factor (IF). The IF for a given year is calculated by dividing the number of citations in that year to all items published in the journal in the past two years by the total number of "citable" items in the two previous years. At the end of 2016, Elsevier introduced a new journal metric called CiteScore. CiteScore differs from the IF in two significant ways: [1] it is determined over a 3 year period, and [2] it includes all items in the denominator rather than just "citable" items (see Figs. 1 and 2 below). These differences are in response to criticism that the IF’s two-year window is not large enough for all research fields – some fields move slower than others – and that the identification of “citable” items by Thomson Reuters, producers of the IF, is not a transparent process.

Fig. 1. Schematic showing how a journal's 2015 CiteScore is calculated. The 2015 IF would include citations in 2015 only to the articles published in 2013 and 2014. Source: https://journalmetrics.scopus.com/

Impact Factor = (CF + CR) / NR
CiteScore = (CF + CR) / (NF + NR)
Fig. 2. Schematic showing which citations and "citable" items are included in the calculation of the IF and CiteScore. Source: http://eigenfactor.org/projects/posts/citescore.php
A number of researchers have begun to argue that journals should emphasize citation distribution curves rather than the IF. In the case of Nature's 2015 IF, the vast majority of articles have an impact less than the calculated value of 38.1 (see Fig. 3 below). It is skewed by a relatively small percentage of very highly cited (100+) articles. For more information see the recent paper by Vincent Larivière and co-workers.

Fig. 3. Distribution curve of article citations used to calculate Nature's 2015 IF
Source: Nature, v. 535 (14 July 2016), p. 210–211 doi:10.1038/nature.2016.20224
Journal Rankings
| Metric | Definition | Tool |
| Impact Factor |
The Journal Impact Factor (IF) is the average number of citations per paper over a two-year period. IF = total citations to all items / number of items published. Editorials, letters, news items, and meeting abstracts are usually not included in the number of items published, but citations to them are included in the calculation. Impact Factors are affected by several conditions and they vary substantially across different research fields. Journal Impact Factors are released annually by Thomson Reuters' InCites Journal Citation Reports. |
Web of Science Journal Citation Reports |
| CiteScore |
Like the IF, CiteScore is an average of citations per paper, but it is calculated over a three-year span and the number of items published includes items such as editorials and letters in addition to the research papers and reviews. CiteScore = total number of citations / total items published. |
|
| Eigenfactor |
Eigenfactor is based on a network analysis of citation activity. The citation network is analyzed to detect a series of clusters that are thought to represent scientific communities. To calculate the Eigenfactor, each journal is assigned to a relevant cluster and its citation patterns are compared to other journals in the cluster. Journals showing more citation activity within the cluster are considered more important within the research community. Eigenfactor scores are released annually by the University of Washington's www.eigenfactor.org (free). The underlying data come from Journal Citation Reports. |
Web of Science Journal Citation Reports |
| SJR |
The SCImago Journal Rank (SJR) measures the number of citations received by its articles weighted by the importance of the source journals. It is intended to measure journal prestige as opposed to journal popularity. Average SJR is equal to 1, which means that journals with SJRs greater than 1 are more prestigious than average. SJR indicators are released annually at Scimago Labs www.scimagojr.com (free). The underlying data come from Scopus. |
|
| SNIP |
The Source Normalized Impact per Paper (SNIP) indicator corrects for differences in citation patterns among disciplines. SNIP = citation count per paper / citation potential within its field Average SNIP is equal to 1, which means that journals with SNIPs higher than 1 are better than average for their discipline. The SNIP was created by Henk Moed. |
Further Reading
-
Beat it, impact factor! Publishing elite turns against controversial metricEwen Callaway. Nature 535, 210–211 (14 July 2016) doi:10.1038/nature.2016.20224
-
Controversial impact factor gets a heavyweight rivalRichard Van Noorden. Nature 540, 325–326 (15 December 2016) doi:10.1038/nature.2016.21131
-
Differences in impact factor across fields and over time.Benjamin Althouse, Jevin West, Carl Bergstrom, Theodore Bergstrom. Journal of the American Society for Information Science and Technology 2009, 60:27-34.
-
The weakening relationship between the impact factor and papers' citations in the digital age.George Lozano, Vincent Lariviere, Yves Gingras. Journal of the American Society for Information Science and Technology 2012, 63: 2140-2045.
-
The Eigenfactor metrics.Carl Bergstrom, Jevin West, Marc Wiseman. Journal of Neuroscience 2008, 28:11433-11434.
-
Comparison of SCImago journal rank indicator with journal impact factor.Matthew Falagas, Vasilios Kouranos, Ricardo Arencibia-Jorge, Drosos Karageorgopoulos. The FASEB Journal 2008, 22:2623-2628.